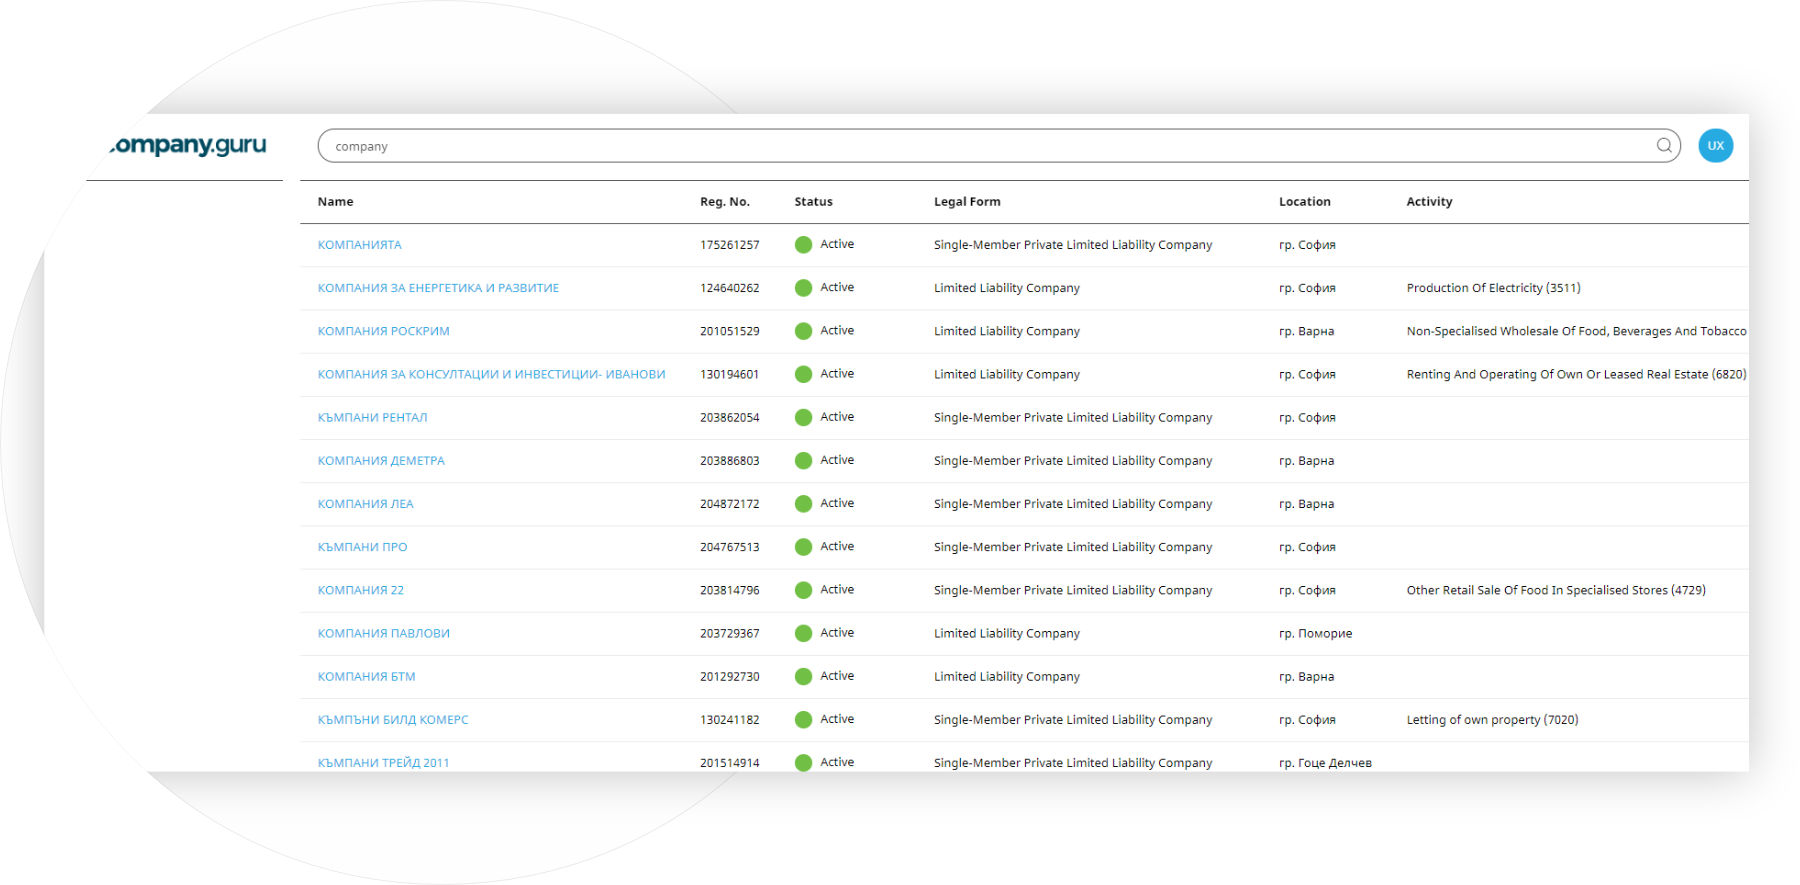
Quick Search has a button and a bar. In the bar you can write in Cyrillic and Latin. As a result, it will show companies / companies whose names start with what is written. That is, this bar is used to find a company / company where you know the whole name or at least the beginning of the name. In this bar you can also search for a company / company by name and by UIC (Unique Identification Number)
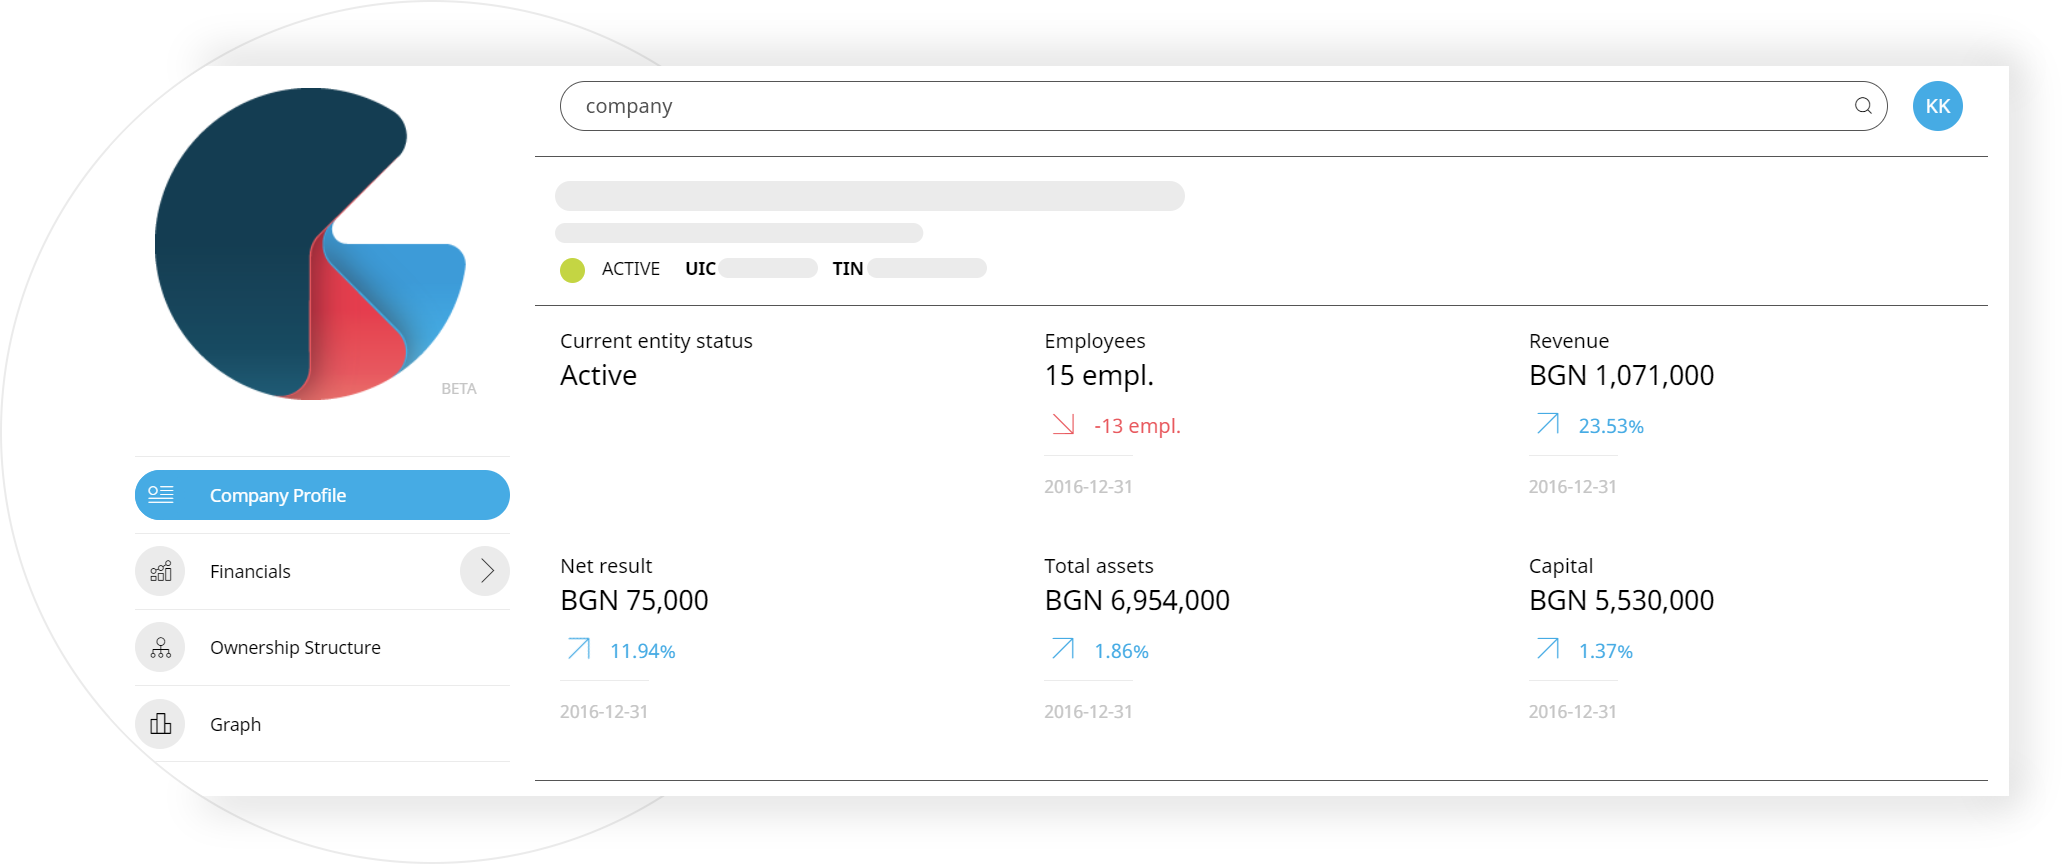
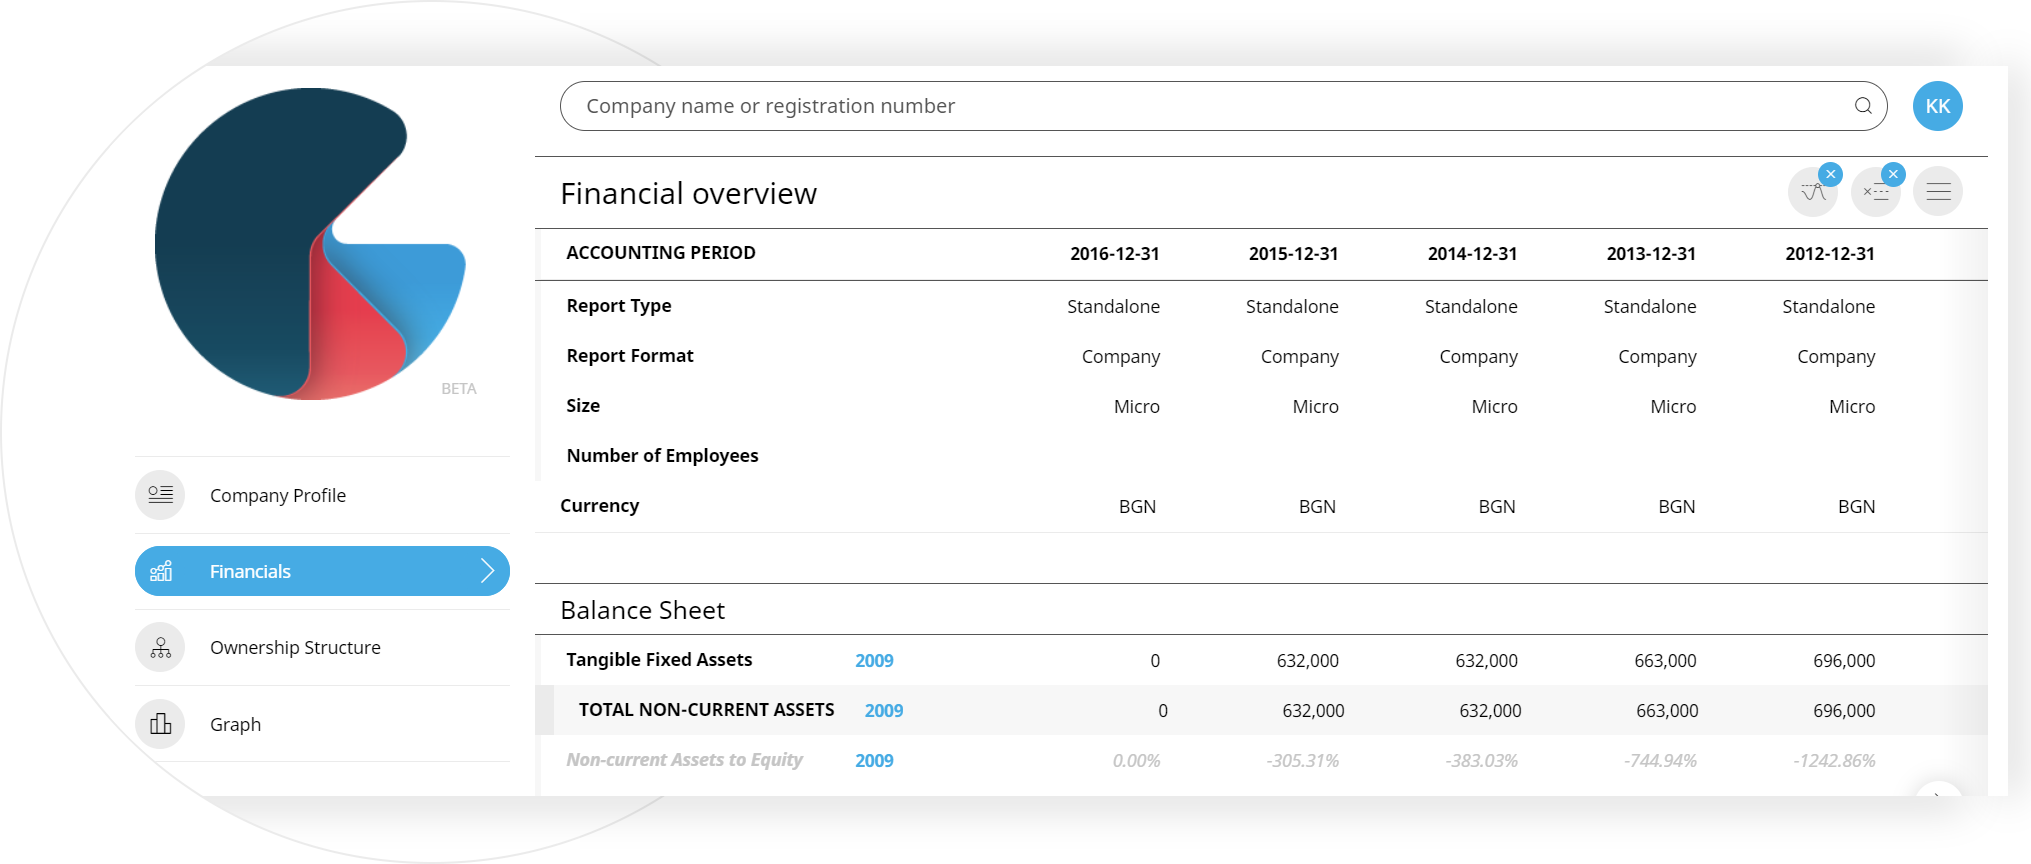
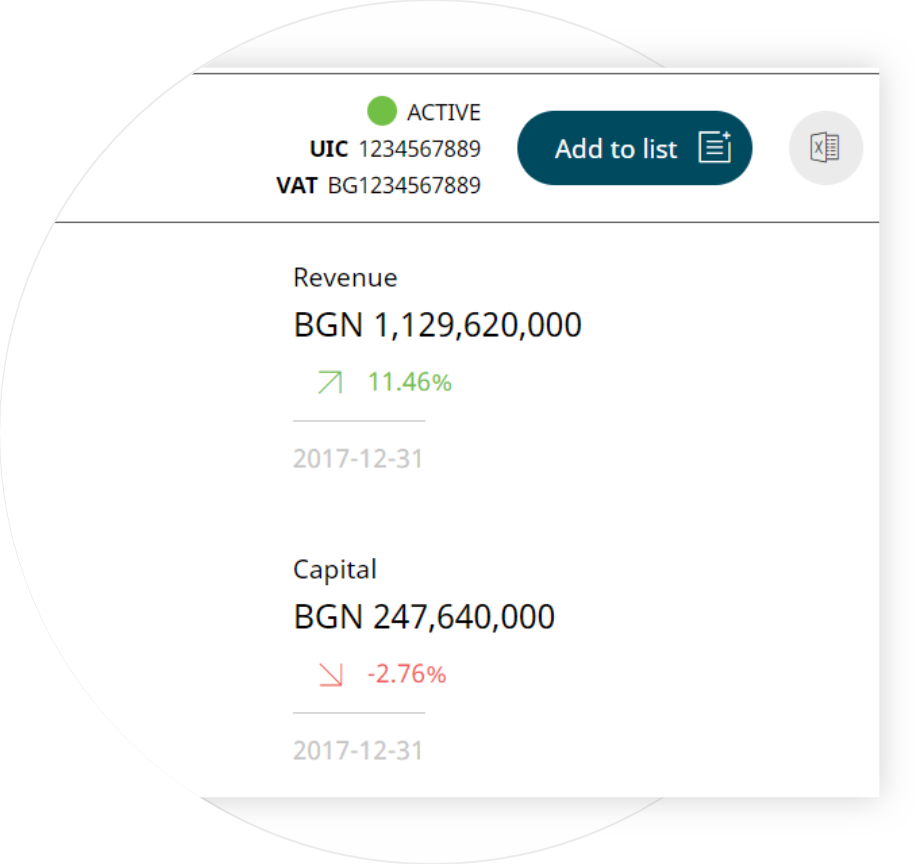
All registry data and contacts are located in the Company Profile section. That's an overview of a company, divided into summarries of key basic registry and financial data..
Registry data is updated every 15 minutes. Financial reports are updated yearly and the other data updates varry. Registry changes are visible almost in real time, as they occur. That way, all the correct and reliable company data are always in front of You, for your convenience.

In order to get familiar with the app in its fullness request a presentation from our team of profesionals.
Request a presentationFor in-depth analysis, we provide a full balance sheet, income statement, financial ratios, VAT registration data, public debth, pledges on company share and ownership strusture, as well as related entities. All mentioned are a part of the our Company Guru - Premium plan, which provides You with premium access.
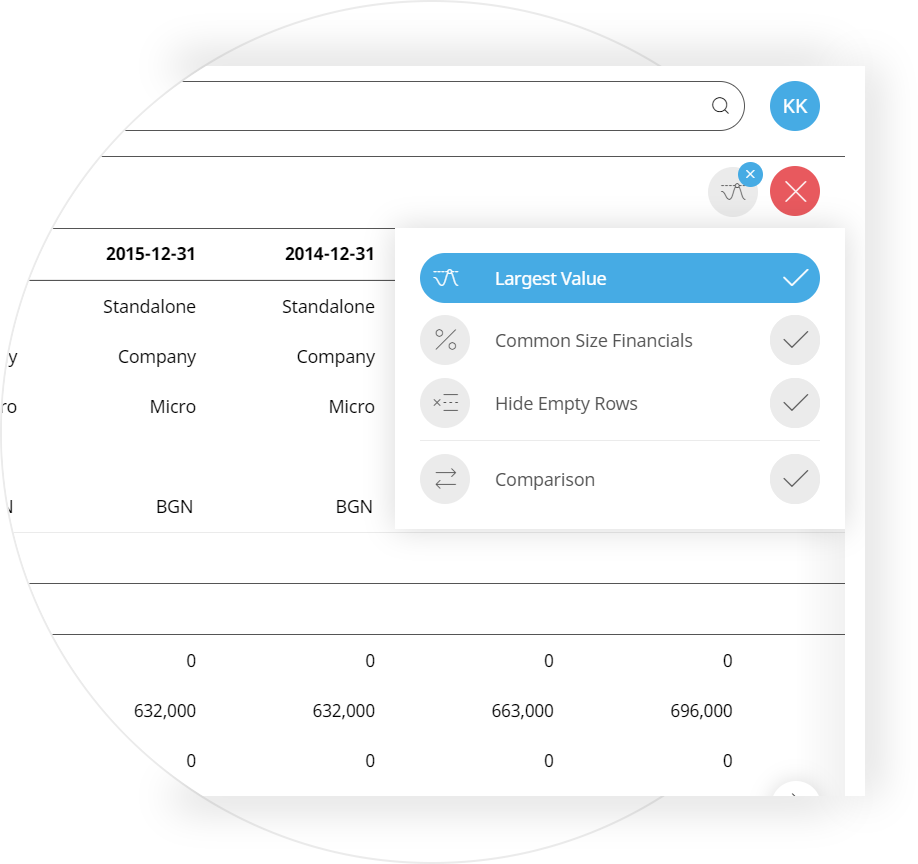
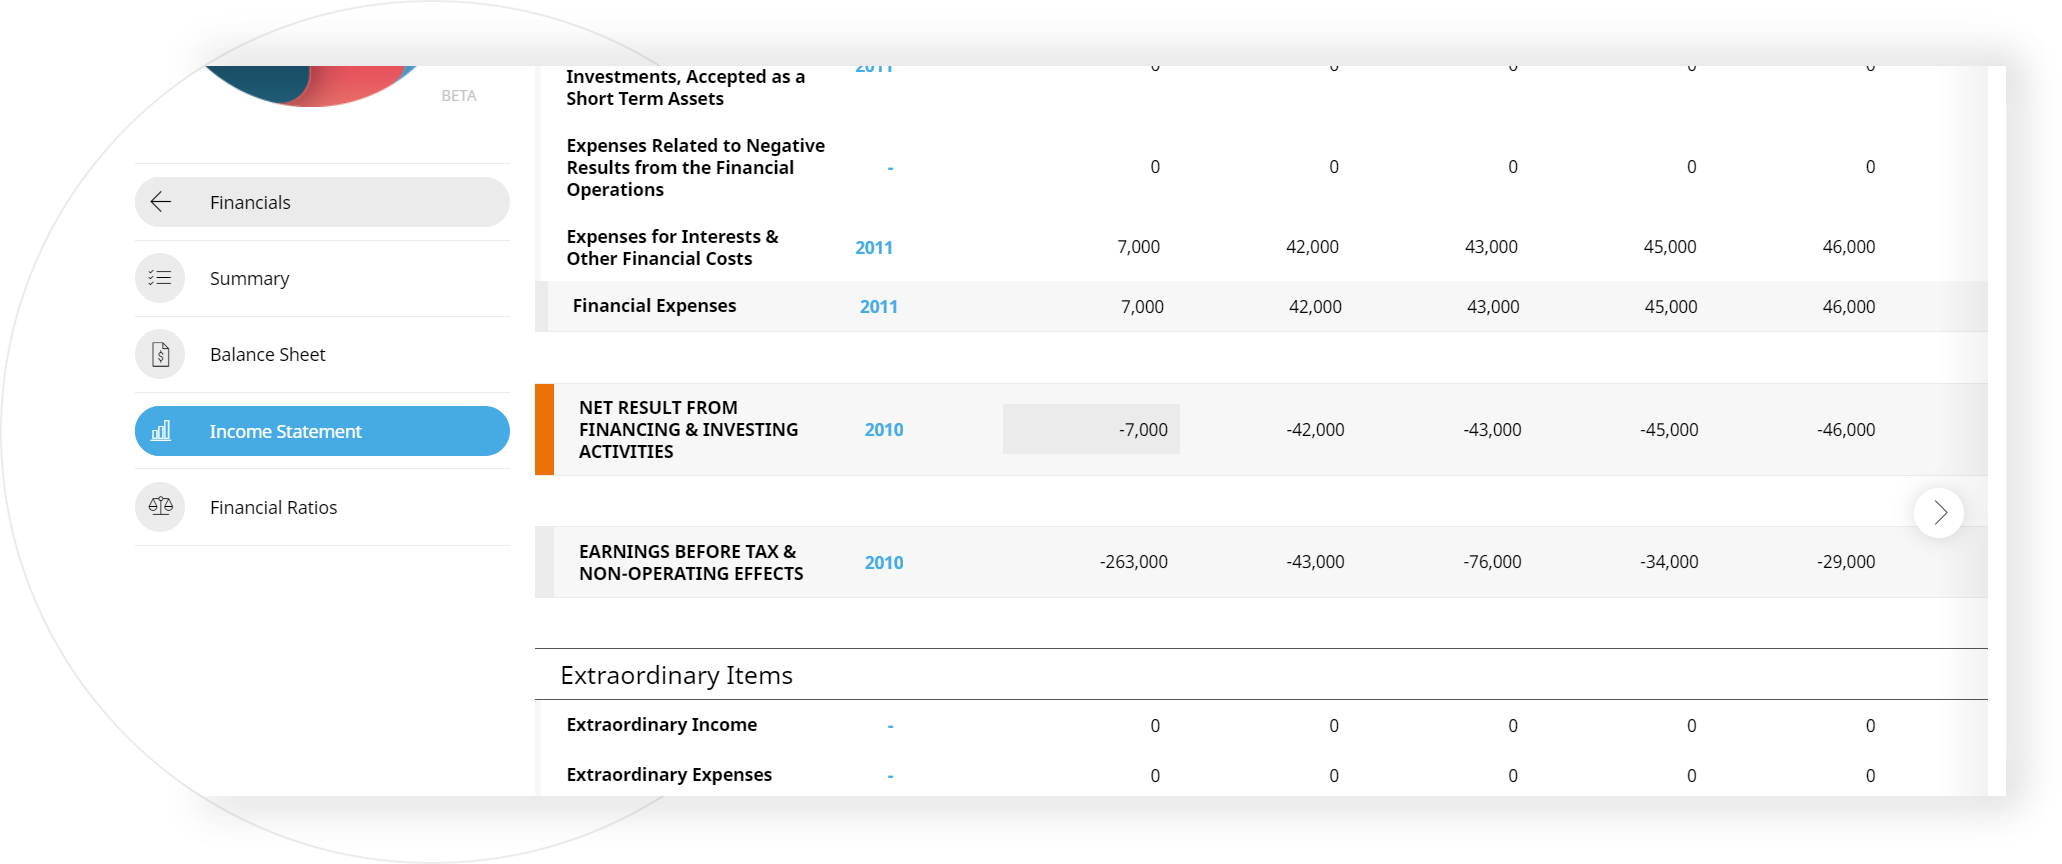
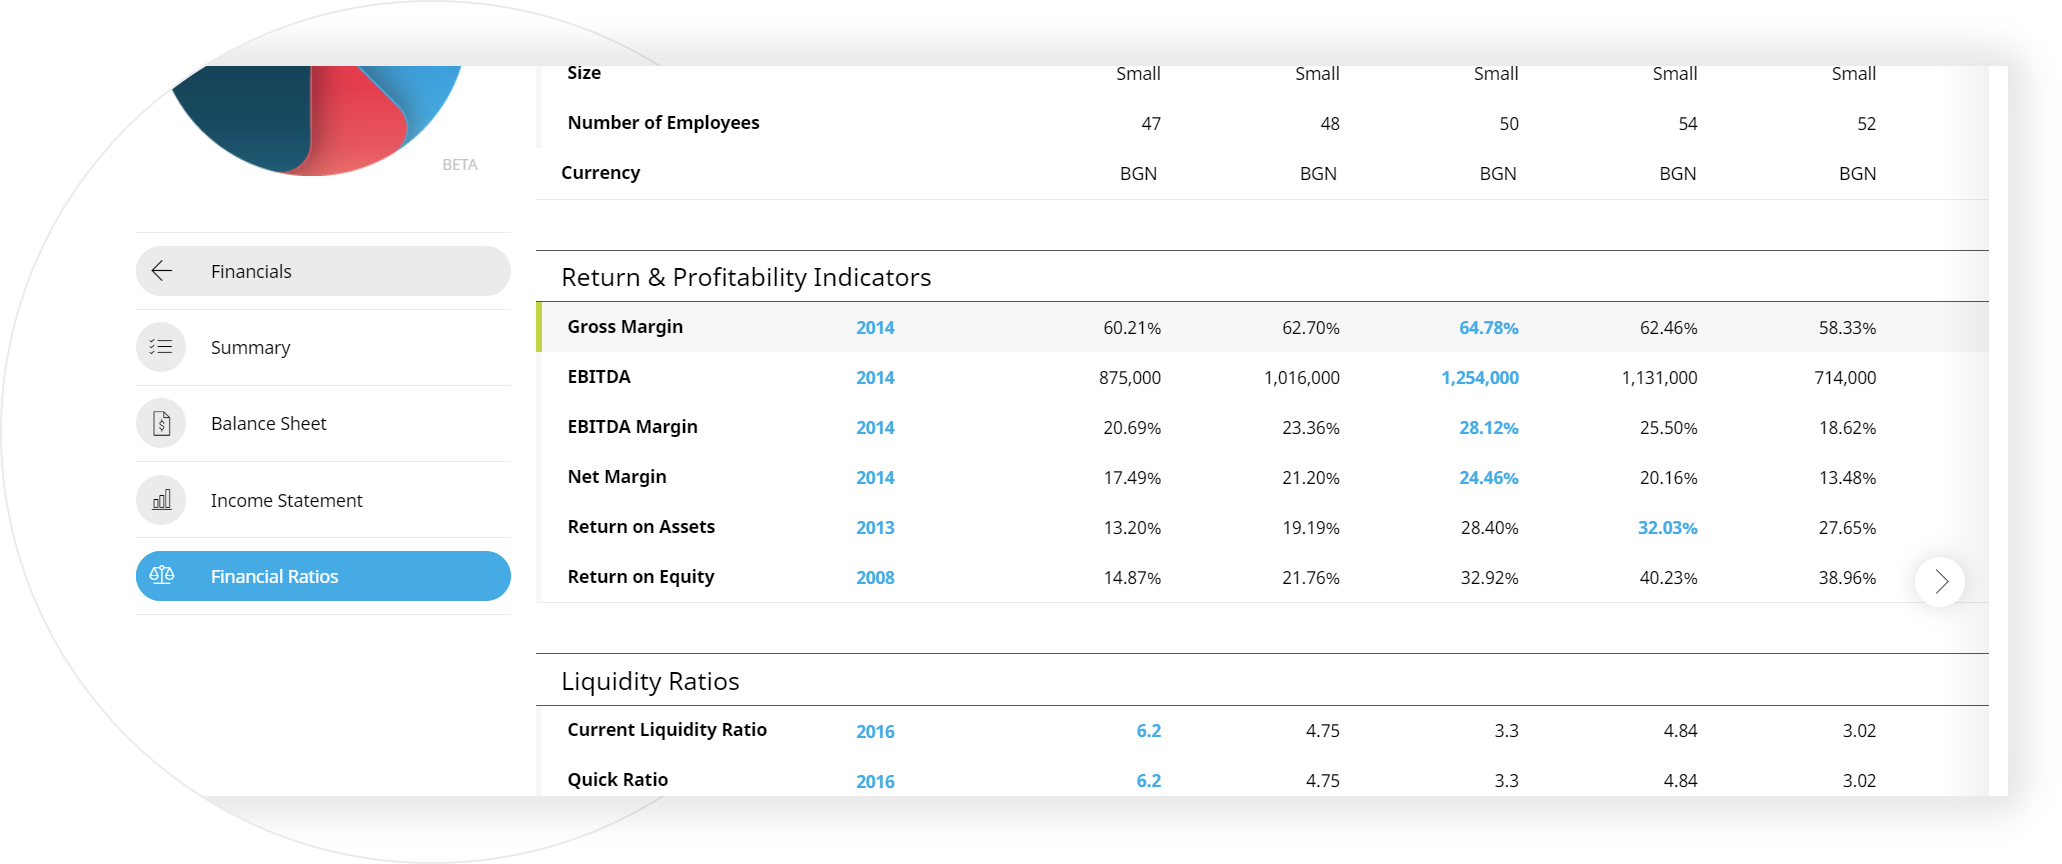
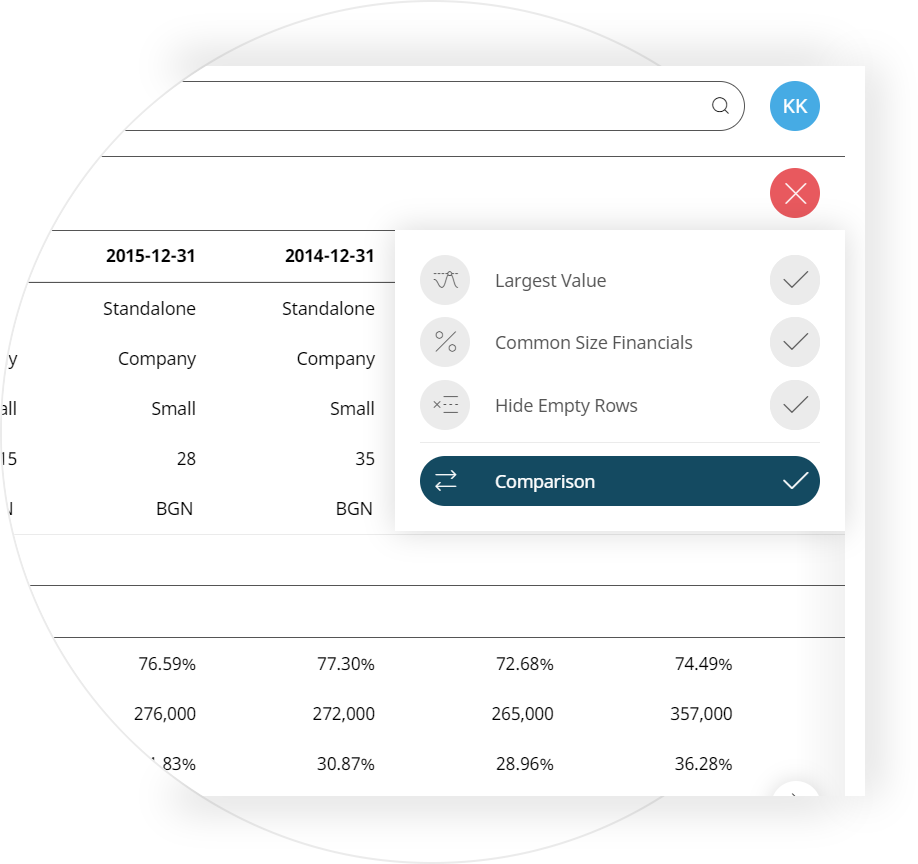
It focuses unequivocally on the best/worst moments in the financial year of the considered company. It will turn blue and focus, literally, on the largest numerical/ percentage values, from the first financial year of the company or from financial year 2007 to the most current financial year.
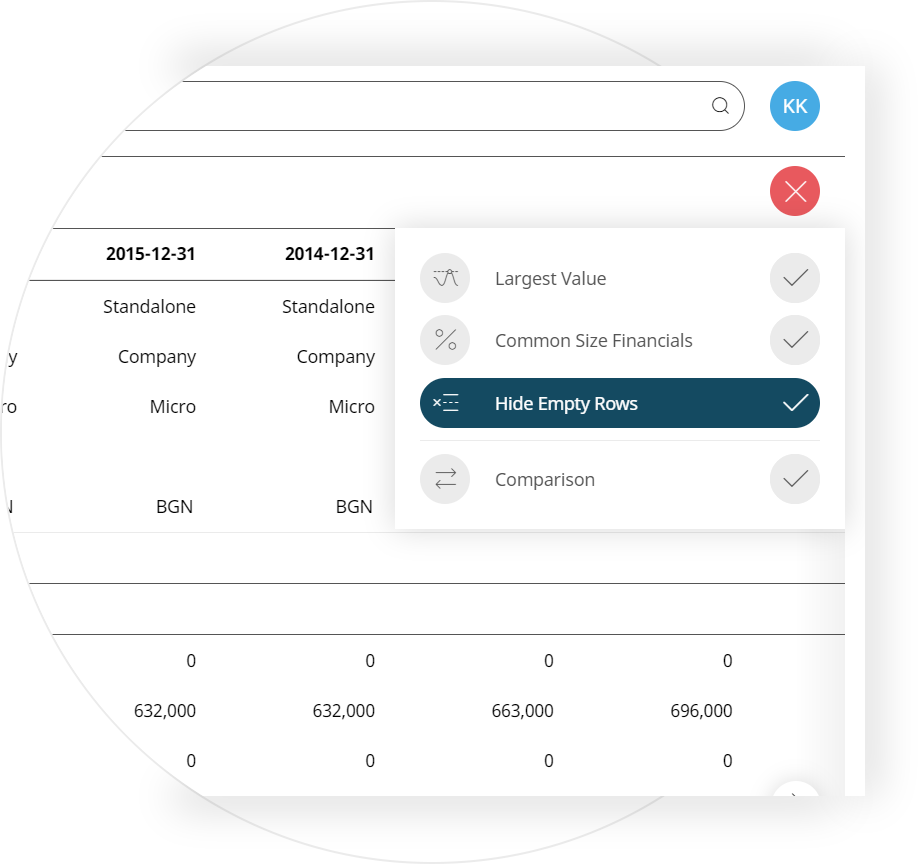
It unambiguously performs the described action to facilitate you in the review, analysis or comparison that you are currently doing for the company in question. Rows are financial indicators, and blanks are understood when the entire chronological order of this indicator shows zero numerical/percentage values.
It is very important, because through it we have the opportunity to compare financial information of up to 10 companies in the same time. Comparison functionlity is a strong analytical tool, which is available only on Company Guru app. Compare companies in terms of competitiveness, market position, comparative analysis of customers, suppliers or partners.
The income statement (ODA) provides information on the effectiveness of the company. If you compare the ODA of several consecutive years, you can clearly follow the trends in the operating activities of the company / company in question. On this basis, you can plan strategies in terms of sales, stocks, fixed costs. ODA is one of the most valuable summaries of how much a company wins or loses during the year. This is done by deducting the cost and expenses from the income, and the net financial result is a profit or loss, it clearly shows how profitable the business is - namely
therefore, every investor or financial institution is interested in it.
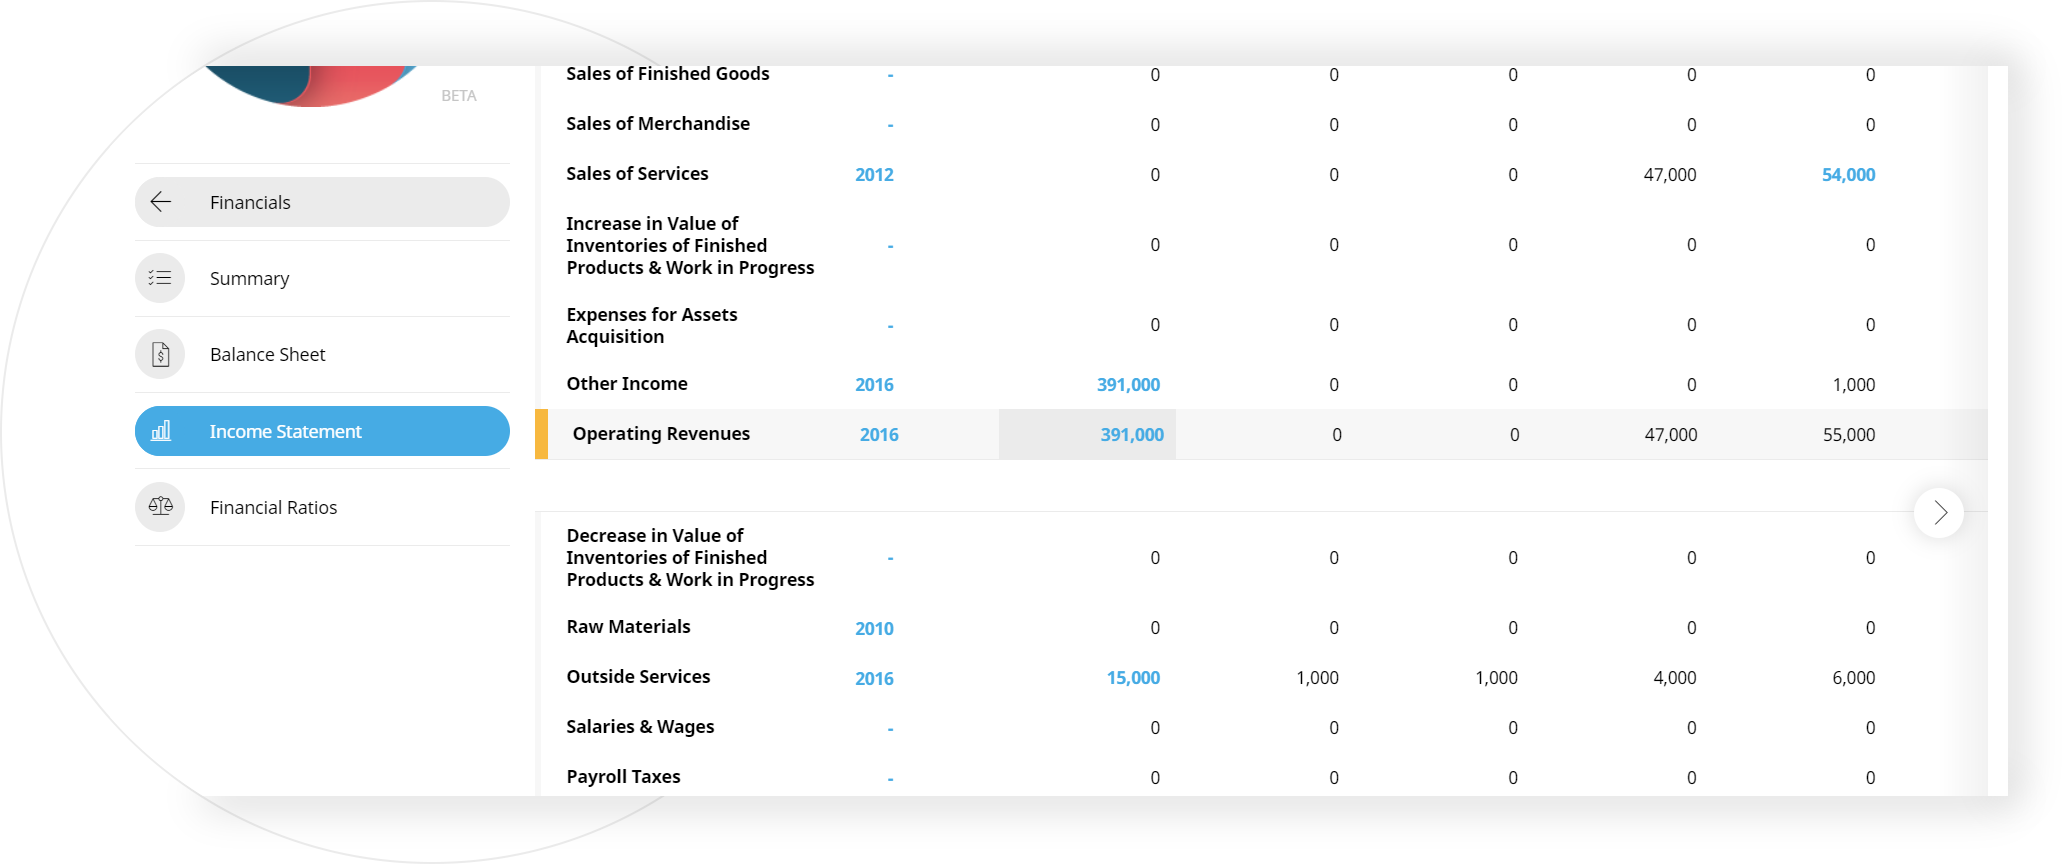
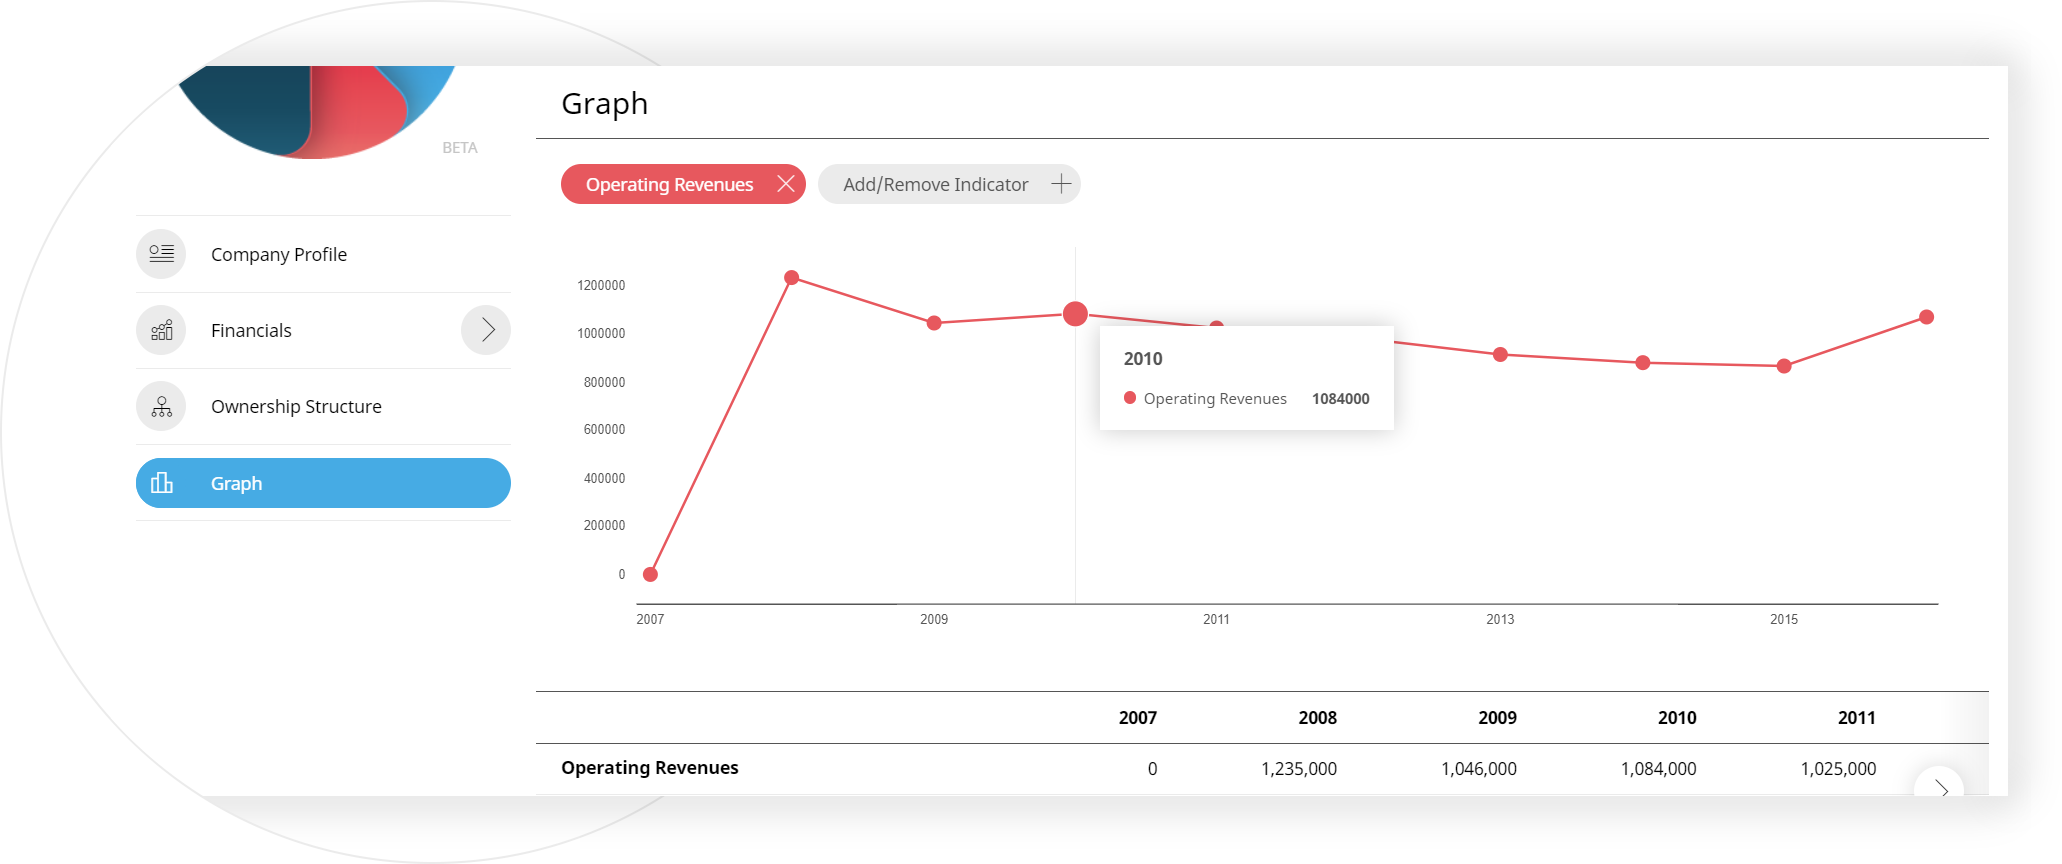
Distinguishing operating revenue from total revenue is important as it provides valuable information about the productivity and profitability of a company's primary business operations. Despite recording operating revenue separately on financial statements, some firms may attempt to mask decreases in operating revenue by combining it with non-operating revenue. Understanding and identifying the sources of revenue is helpful in assessing the health of a firm and its operations.
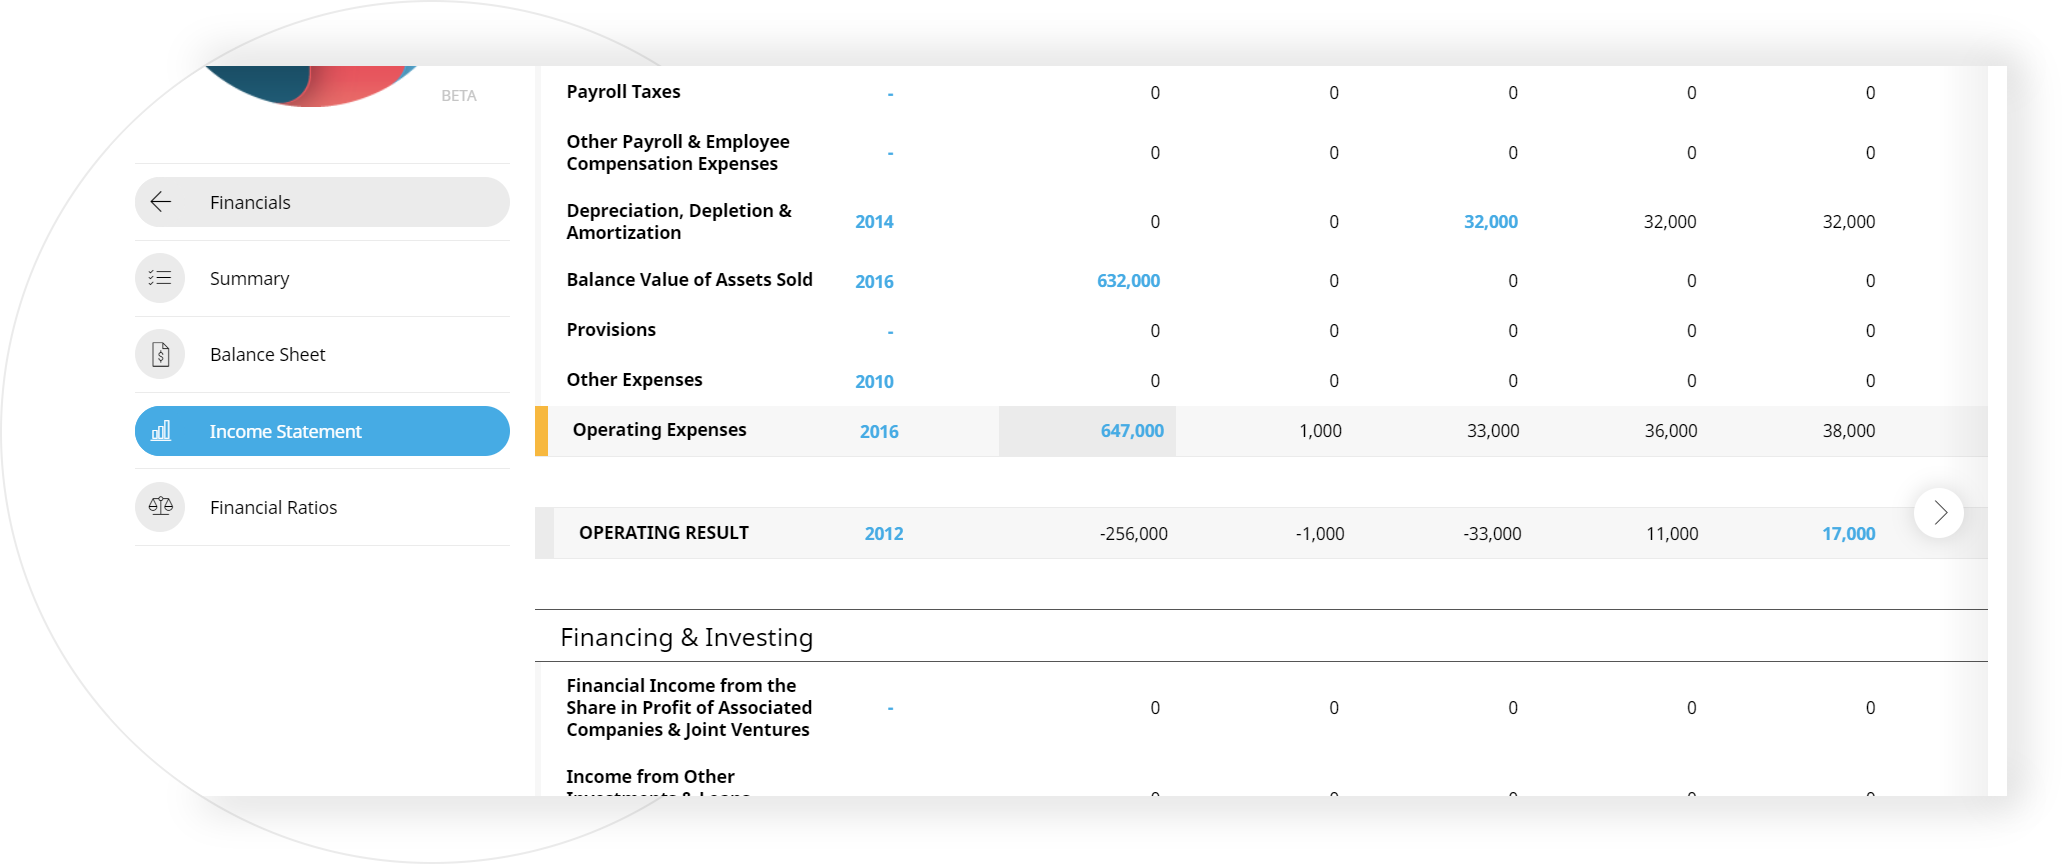
Operating expenses are necessary and unavoidable for most businesses. Some firms successfully reduce operating expenses to gain a competitive advantage and increase earnings. However, reducing operating expenses can also compromise the integrity and quality of operations. Finding the right balance can be difficult but can yield significant rewards.
The balance sheet is a snapshot representing the state of a company's finances at a moment in time. By itself, it cannot give a sense of the trends that are playing out over a longer period. For this reason, the balance sheet should be compared with those of previous periods. It should also be compared with those of other businesses in the same industry since different industries have unique approaches to financing.
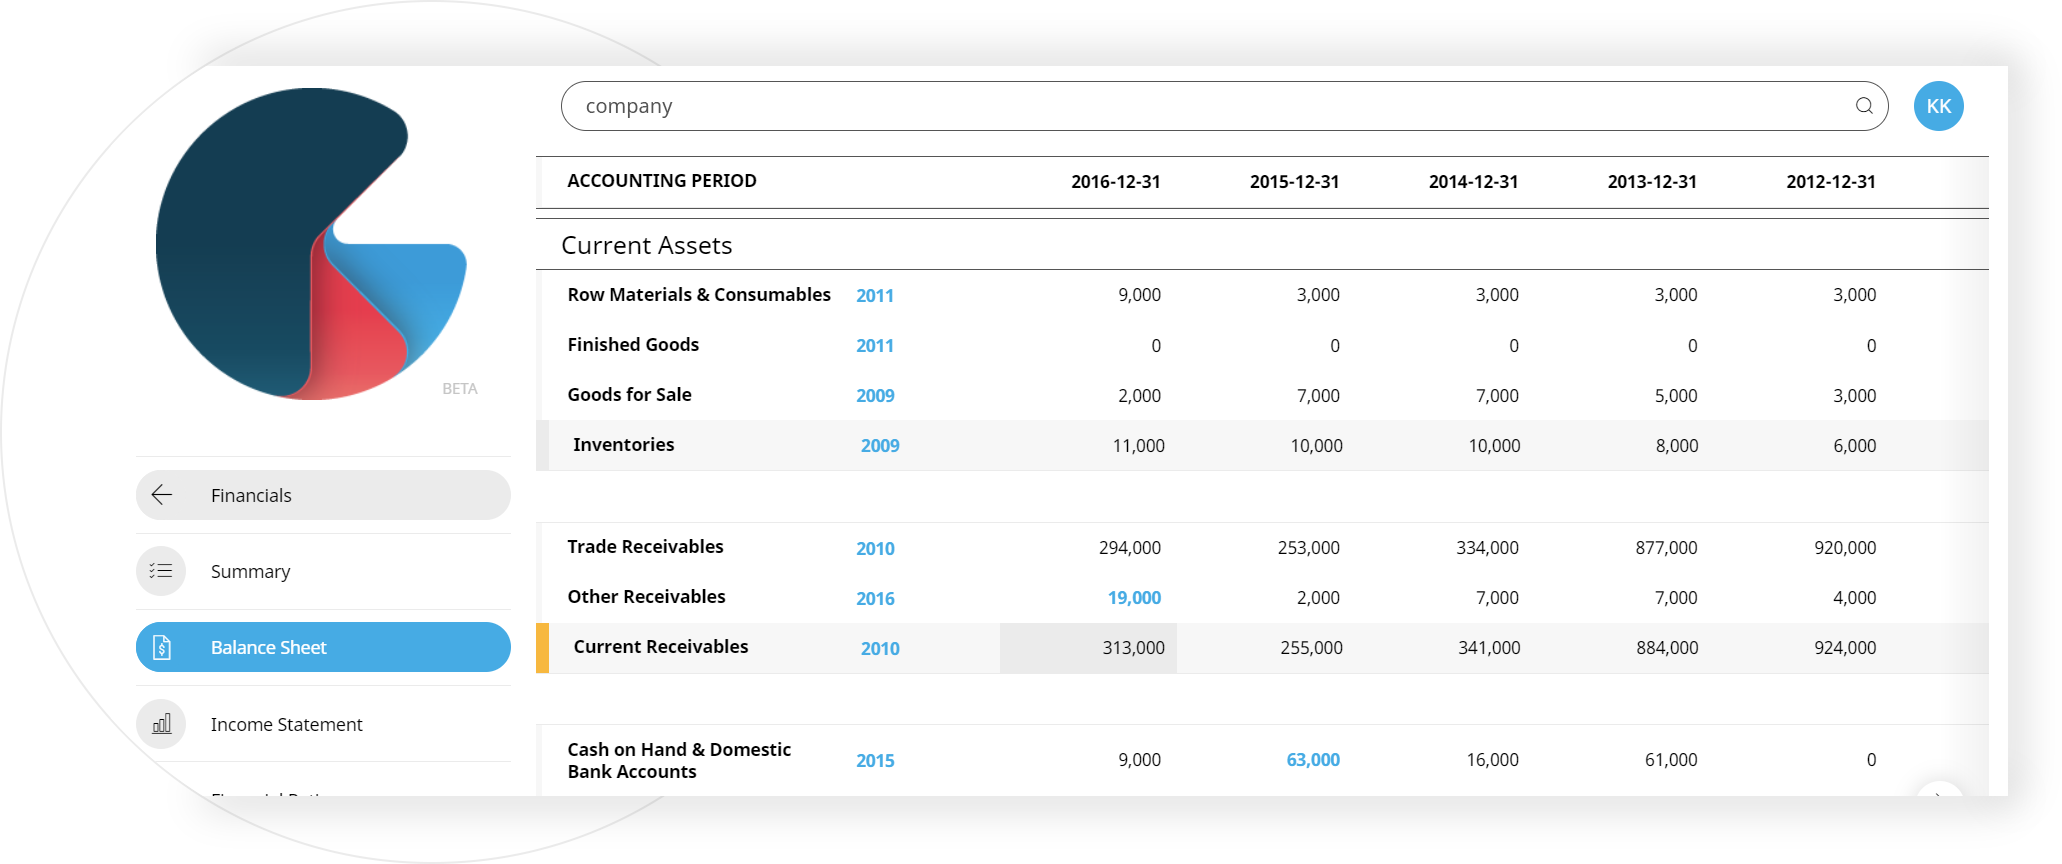
The most valuable information to look for in the balance sheet is the decrease or increase of current or short-term receivables and inventories and their relationship to the level of operating revenue. Short-term receivables and inventories shouldn't be a vast majority of company's operating revenues, but the general rule is that should be within the limits determined by the Accounts Receivable Turnover Ratio in the observed industry. Notice the value of current receivables and long-term receivables and their relationship in operating income and operating result.
Ratio Analysis is the core of financial analysis. Ratios provide input for evaluating and comparing a company to its competitors, or to an industry average. Ratios provide the vital signs used to measure one company’s health, allowing to look further into specific aspects of the company’s activities. For example, the company may be profitable, but certain ratios could indicate that it doesn't manage inventory well, or that it has cash flow issues.
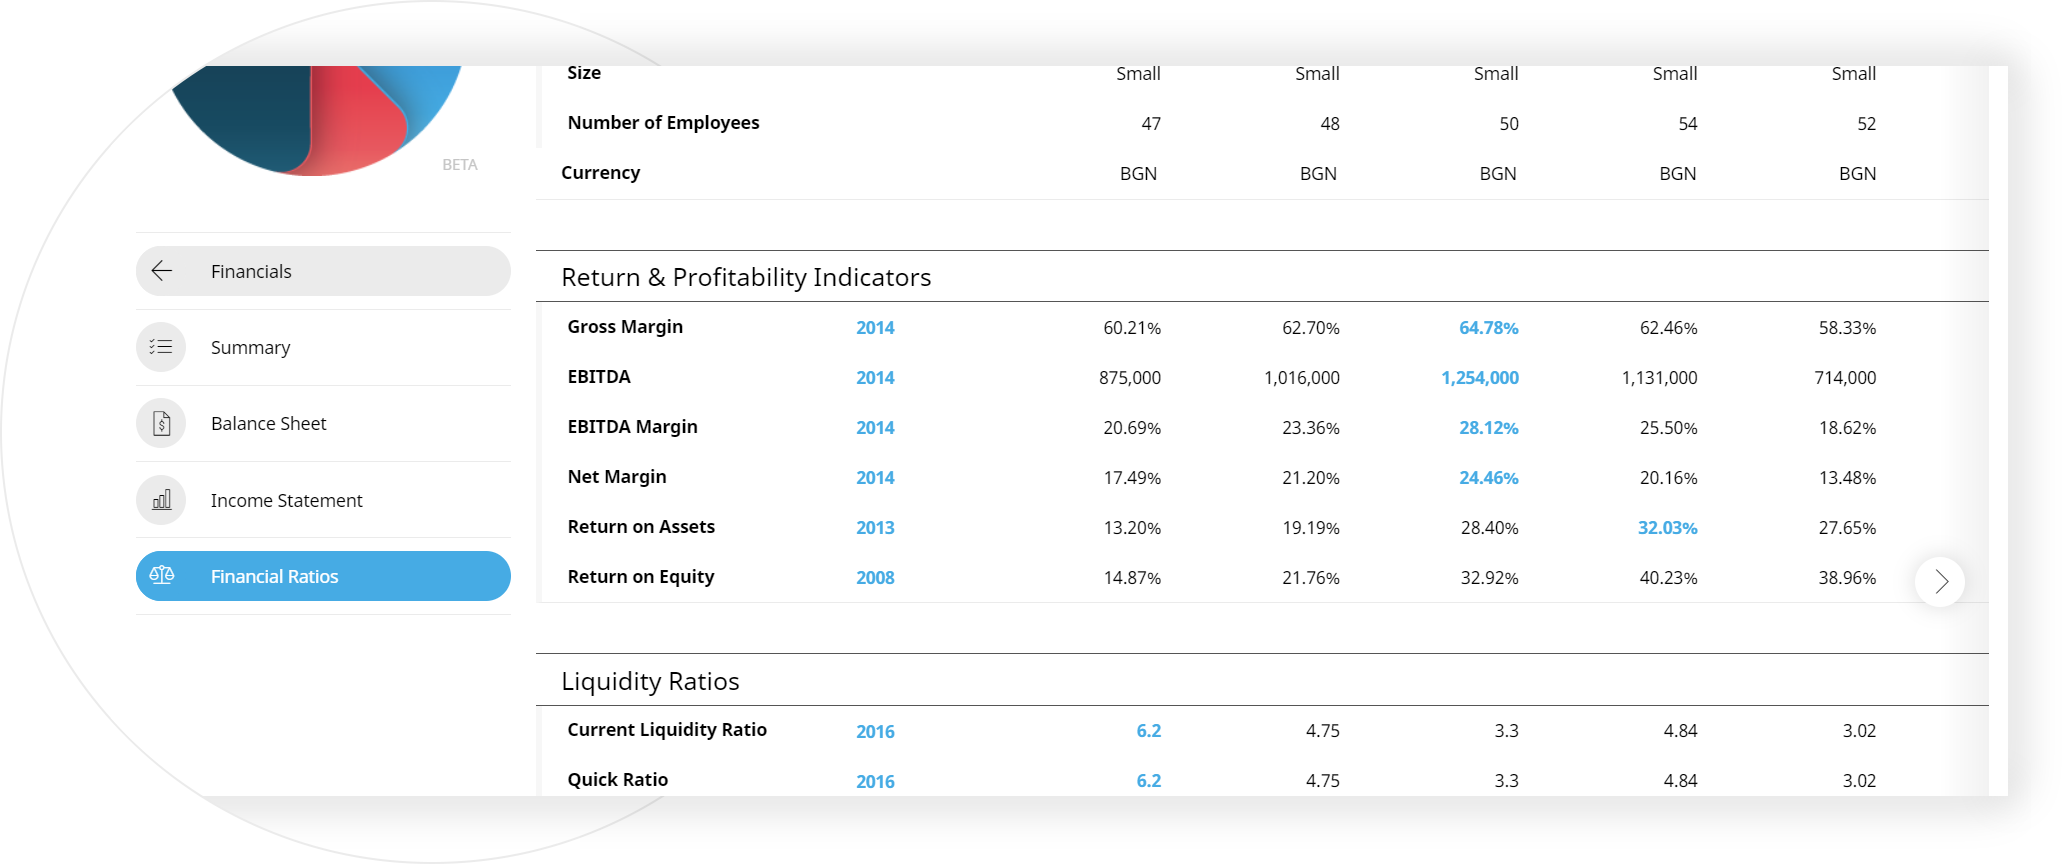

Prudent investors know that a precise definition of return is situational and dependent on the financial data input to measure it. An omnibus term like profit could mean gross, operating or net, before tax or after tax revenues or income. An omnibus term like investment could mean selected, average or total assets, debt or equity.
The gross profit margin shows us what% of sales remain to cover fixed costs and to generate net profit. It is also used to define the Break-Even Point, at which sales coincide exactly with fixed and variable costs and above which the business begins to generate profit.
Net profit margin is one of the most important indicators of a company's financial health. By tracking increases and decreases in its net profit margin, a company can assess whether current practices are working and forecast profits based on revenues. Because companies express net profit margin as a percentage rather than a lev amount, it is possible to compare the profitability of two or more businesses regardless of size.
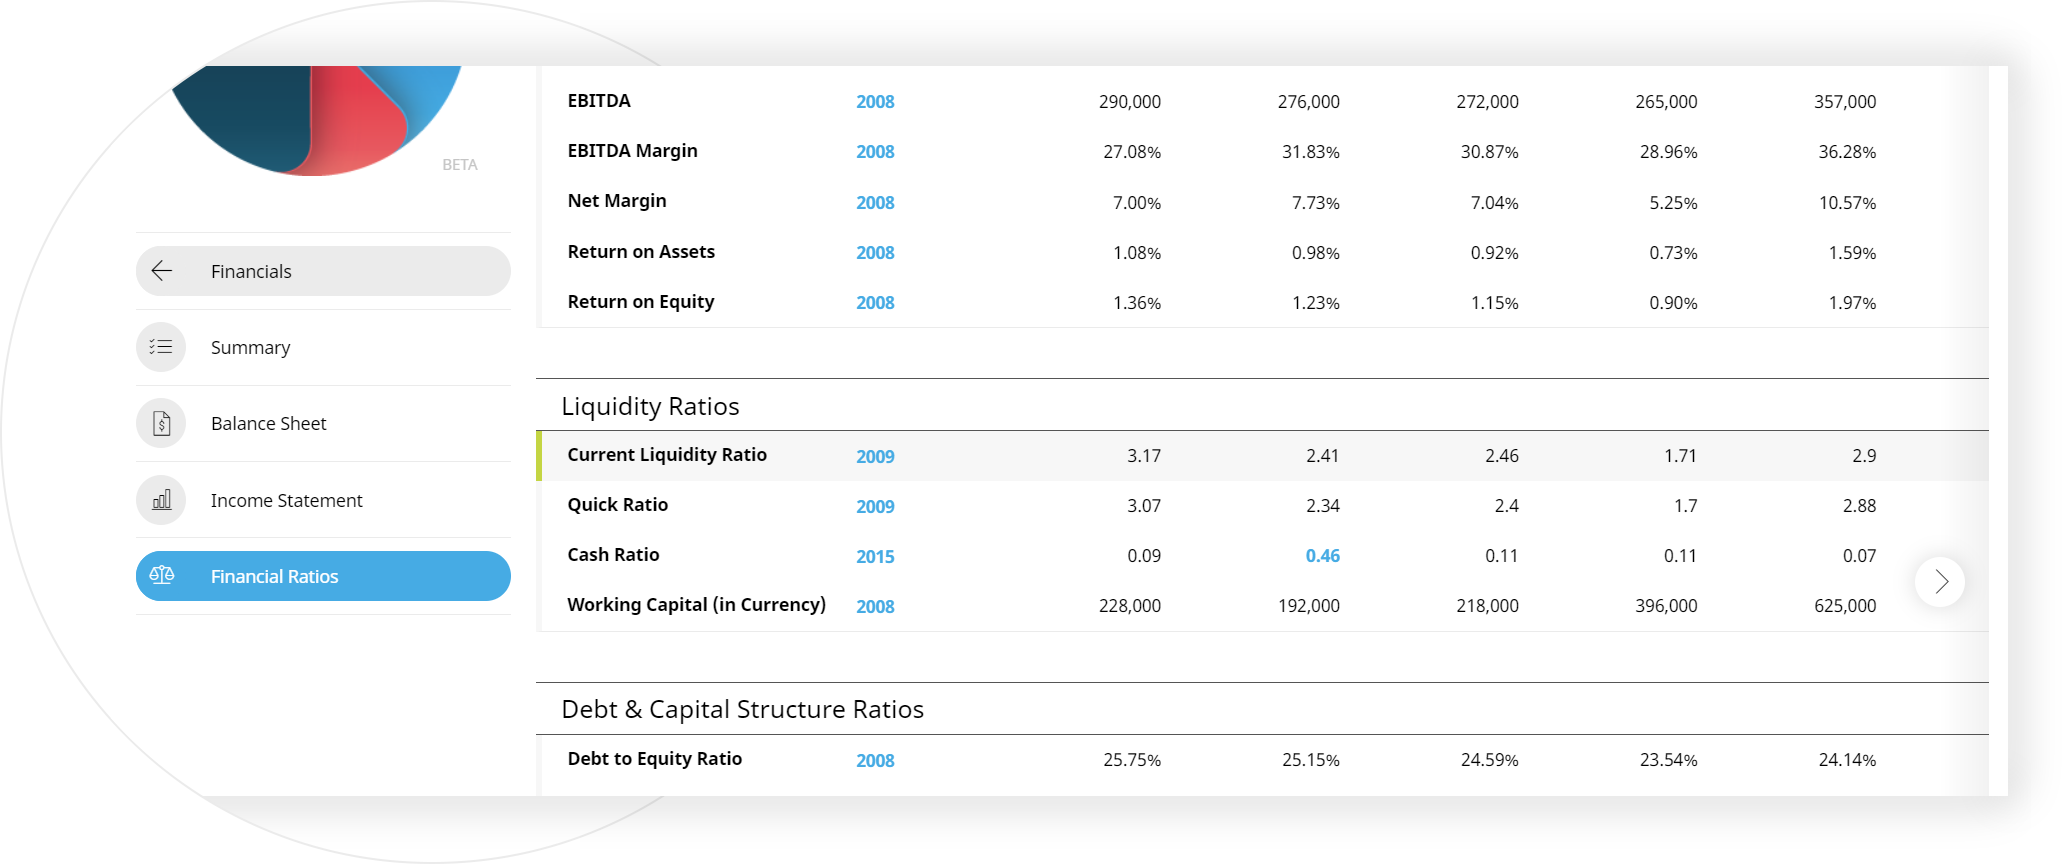
Liquidity is the ability to convert assets into cash quickly and cheaply. Liquidity ratios are most useful when they are used in comparative form. This analysis may be internal or external. For example, internal analysis regarding liquidity ratios involves using multiple accounting periods that are reported using the same accounting methods. Comparing previous time periods to current operations allows analysts to track changes in the business. In general, a higher liquidity ratio shows a company is more liquid and has better coverage of outstanding debts.
Alternatively, external analysis involves comparing the liquidity ratios of one company to another or an entire industry. This information is useful to compare the company's strategic positioning in relation to its competitors when establishing benchmark goals. Liquidity ratio analysis may not be as effective when looking across industries as various businesses require different financing structures. Liquidity ratio analysis is less effective for comparing businesses of different sizes in different geographical locations.
Use real time comparison feature. It is very important, because through it we have the opportunity to compare financial information of up to 10 companies in the same time.
Comparison functionlity is a strong analytical tool, which is available only on Company Guru app. Compare companies in terms of competitiveness, market position, comparative analysis of customers, suppliers or partners.
Compare the company to its peers, industry benchmark, or good companies from your portfolio and go again through all these steps. This way you will find better insight into all the parameters observed. Whether they are larger, smaller or the same and draw conclusions about the performance of the particular company.
Use the Graph on Company Guru app. You can add and remove economic indicators on the chart depending on your business needs. The data for the economic indicators come from the ones published by the company. Graphs are an excellent analytical tool for analyzing Your client portfolio, competition, suppliers and prospects. Check out key indicators in following content.
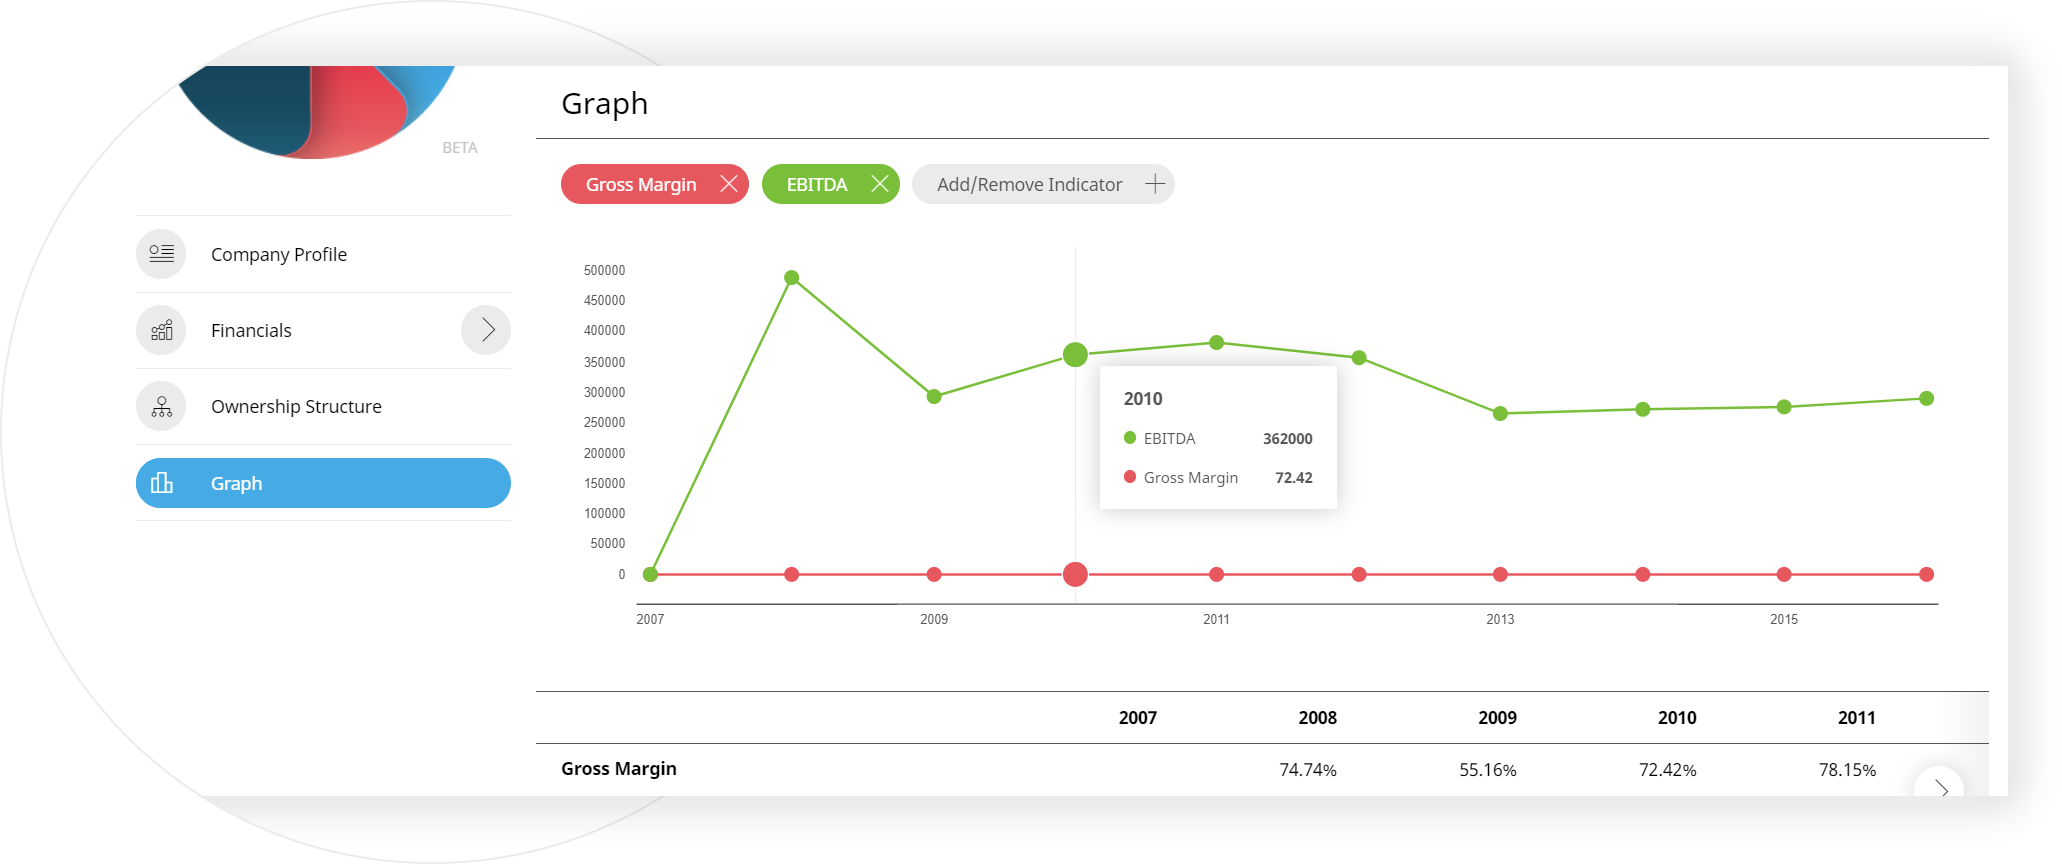
Gross Margin as indicator makes sense only if being compared with industrial average or competition. This way you will understand if these values are within normal range or less than an average.
EBITDA (Earnings Before Interest, Taxes, Depreciation and Amortization) is calculated using company net earnings, before interests, taxes and depreciation and amortization. It is used as an approximation for current operational profitability as well as the cash flow. This measure allows you to compare the profitability of the different companies, neutralizing the effect of paying interest rates from different sources of financing, various administrative jurisdictions (ignoring taxes) and the way to acquire and maintain assets (ignoring depreciation and amortization). You can compare a business with another, even from other industries.
The negative EBITDA tells us that the company has problems with profitability and cash flow. On the other hand, a positive EBITDA does not mean that the company generates (enough) cash.
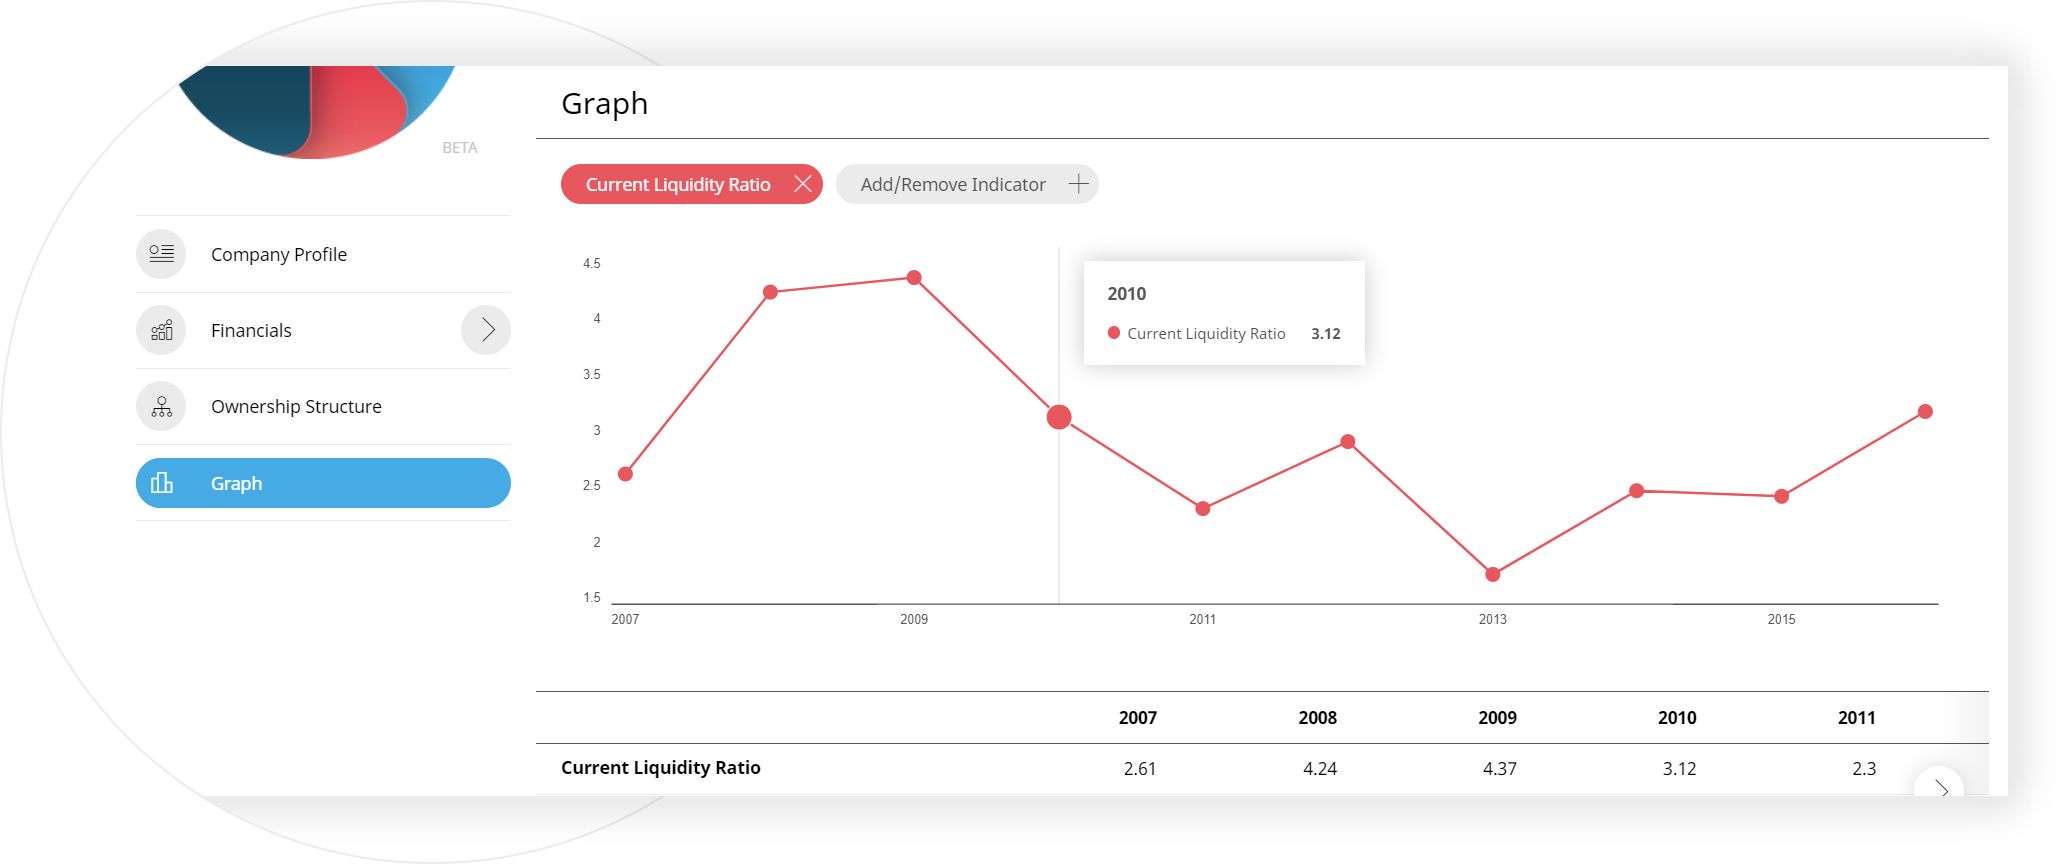
Compare the liquidity of one company to another checking the Current Liquidity Ratios. More liquid companies are better prepared for market disturbances, such as price war as well as more unlikely to get into trouble in the near future.
Lists are an easy way to organize your customers, suppliers, or potential clients in one place. This advanced feature allows you to easily access company profiles and other information and track the changes within the list. You can export lists in .csv format and enrich Your CRM or other operational program with it.
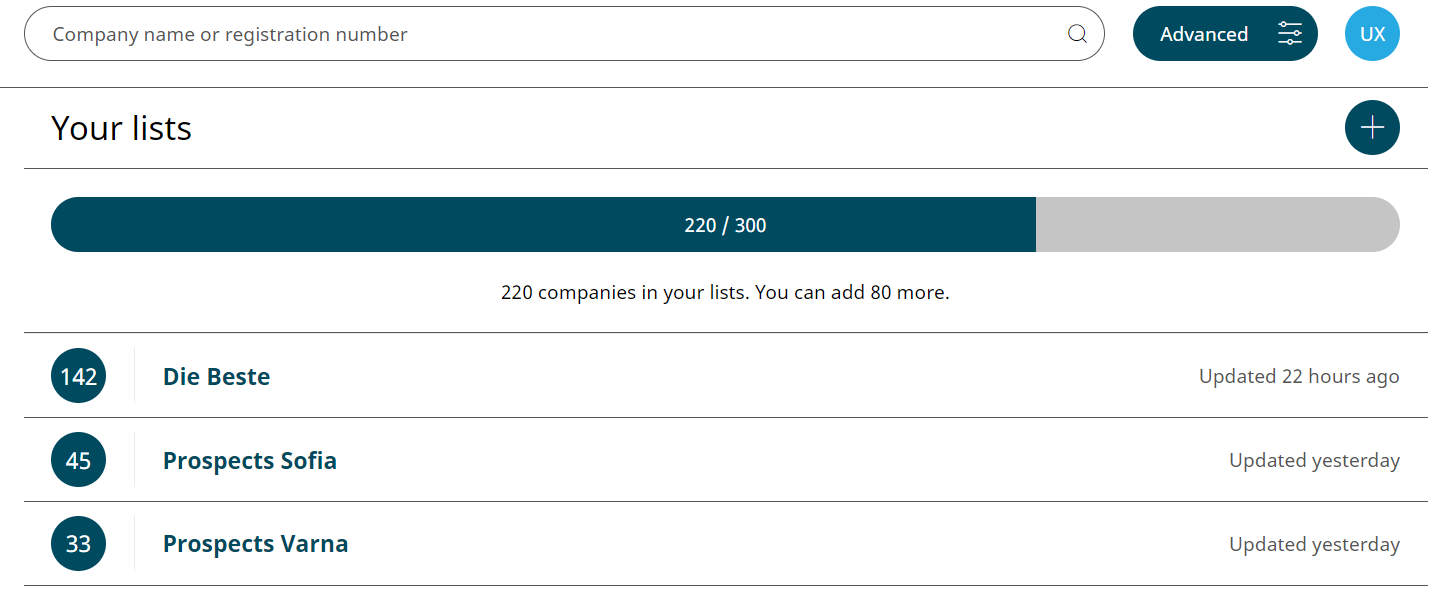
Start with Your portfolio or prospects - organize them in separate lists by the size, location, strategic importance, asigned salesperson etc. You can create a list of companies with the Lists module by clicking the Create a List button .
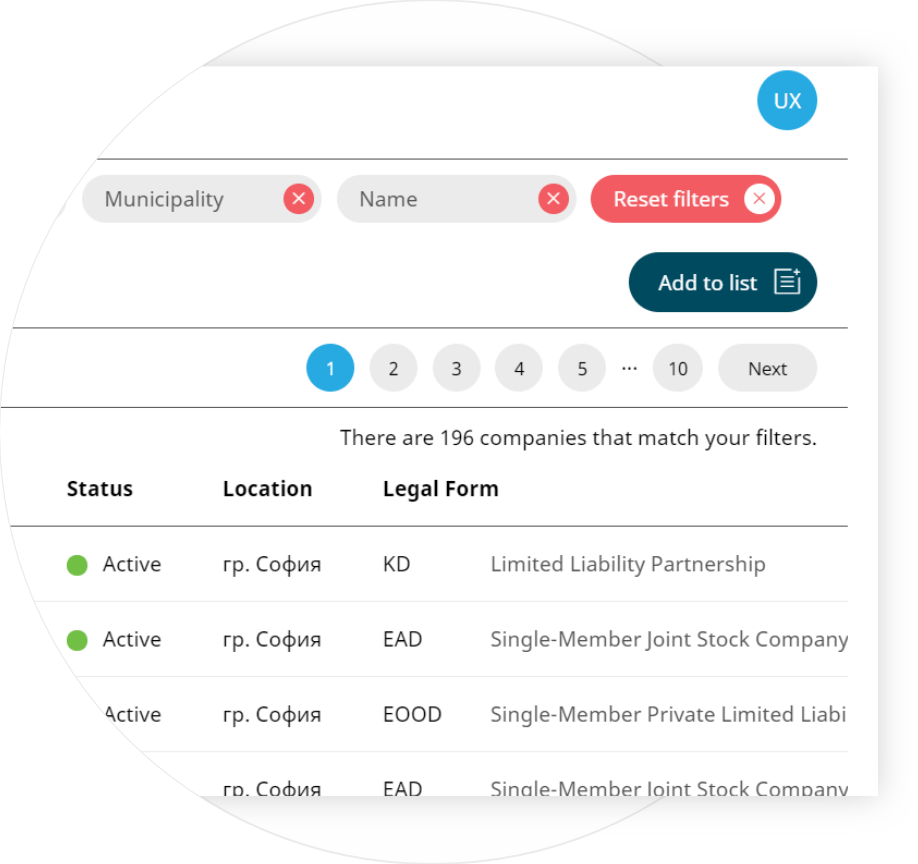
Populate the list with desired companies using the Advanced search, selecting search results and clicking Add to List.
Individual companies can be added to the list via the Company Profile using the Add to List button.
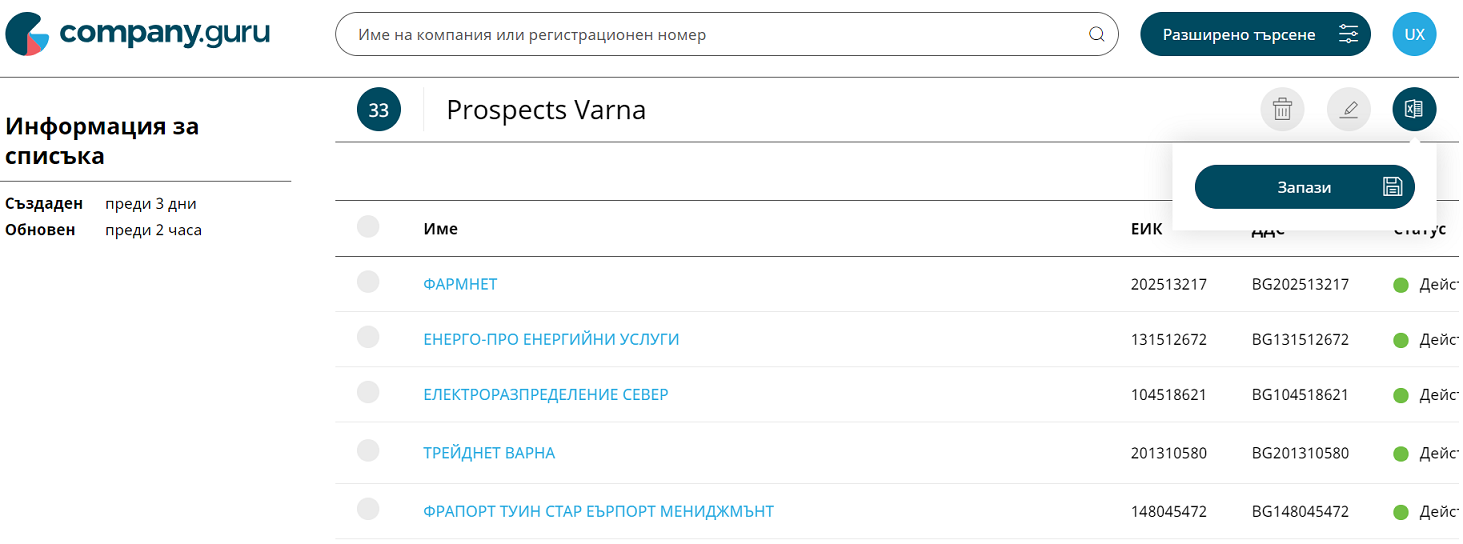
Download the list by clicking the Export and Save button and get an .csv file with the companies and their main registration and financial information, such as activity, location, contacts, revenue, net result, and more than 15 other data units type.

For Company Guru requests, updates or presentations contact us at [email protected]